.png?width=202&height=50&name=Logo%20(1).png)
 Key Capabilities
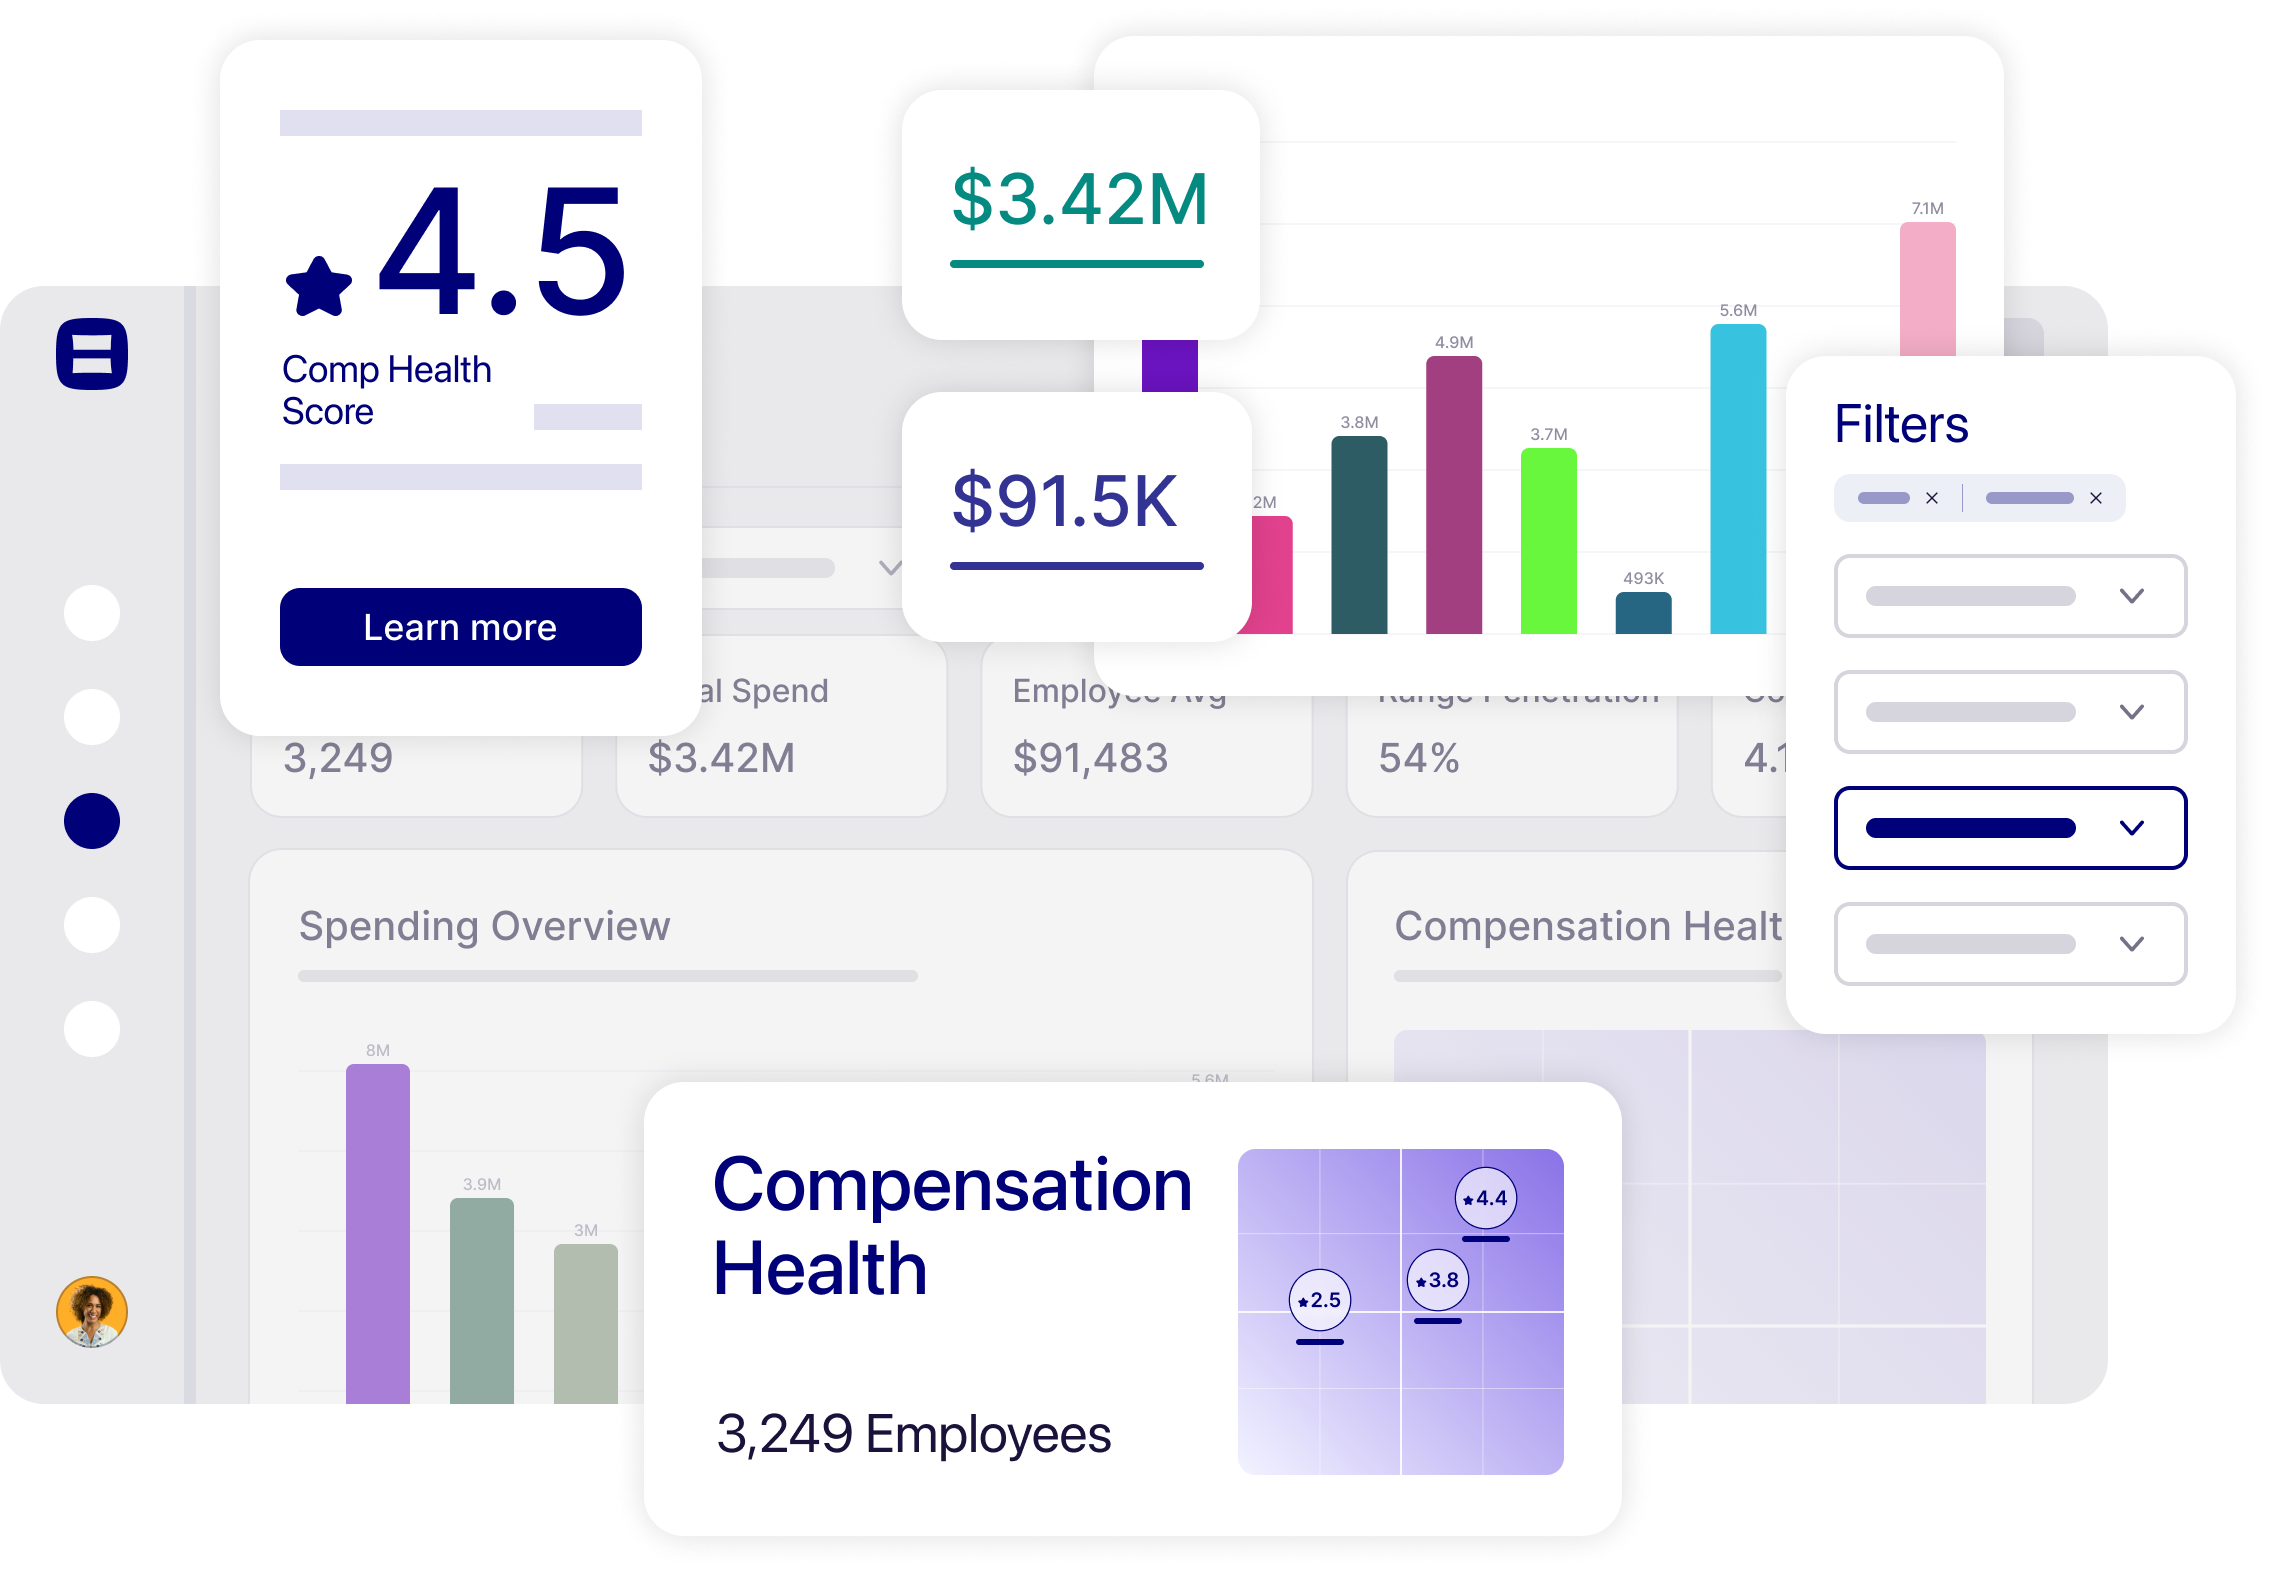
Visualize Your Data
-
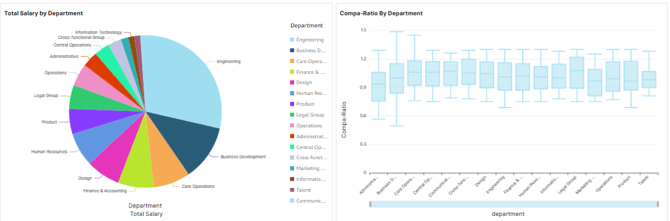
Generate dynamic charts and graphs directly from your people data and compensation cycles.
-
Avoid the need for complex spreadsheets or manual formatting.
AI-Powered Questions
Ask natural-language questions about your data, and Insights will return the appropriate visualization or report. Examples:
-
What Is The Cost To Bring Underpaid Employees To Market Rate?
-
Compensation Summary By Job And Level?
-
Which Employees Are Underpaid By Department?
-
Total Salary By Start Date Quarterly, Split By Department?
- Histogram Of Salary Penetration
-
Which Employees Have A High Flight Risk? Include Tenure And Compa-Ratio
-
Average Tenure By Department?
-
What Is The Average/Median Compa-Ratio By Level ?
-
What Is Our Annual Equity Burn Rate And How Does It Compare To Our Authorized Share Pool?
-
How Many Employees Are Approaching Major Vesting Cliff Dates?
-
What Equity Granted Percentage By Department Compare To The Total Equity Granted?
-
What's The Total Value Of Equity Vesting In The Next 12 Months?
-
Change chart types, adjust filters, and group data to fit your workflow.
-
Focus on the metrics and KPIs most relevant to your business needs.
Share and Download
-
Download visuals for inclusion in decks, reports, or presentations.
-
Share with internal stakeholders for faster, more informed decision-making.
When to Use Insights
Use Insights when you need to:
-
Prepare for compensation cycles.
-
Identify pay gaps or equity concerns.
-
Track trends in total compensation over time.
-
Provide leadership with clear, data-driven updates.